Welcome to choose us, Shanghai Hengyuan Biological Technology Co., Ltd.!Free service hotline:400-0899-208
Language:CH Security check


- Location:
- 首页>
- News>
- Industry news>
- Constant biology | t...
Industry news
Constant biology | those things that fit the ELISA curve
We have a lot of customers to consult ELISA experiment after how to carry out the curve? For so many curve formulas, how do we choose the best fitting equation? Constant bio small editor to summarize: ELISA curve fitting those things.
We can generally draw with software can also be produced by Excel. According to the scientific method of analysis, if there are singular points or stains, it is not good to use linear analysis directly, so we should choose several points of the fitting curve, at the same time, we can use double logarithmic straight line fitting or four-parameter curve fitting.
Then the common curve fitting regression equations are as follows:
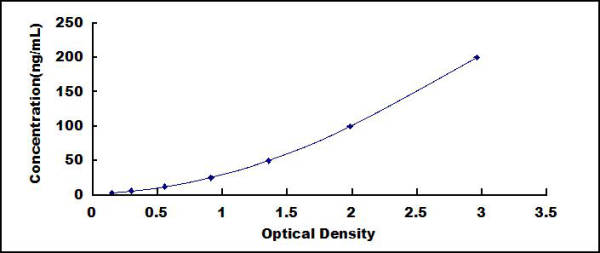
The first is linear regression: linear regression is the simplest regression model, is also the most basic curve fitting regression analysis method, will all test points fitted into a straight line, the fitting function equation is: y = a + BX. But because of the excellent linearity in the actual experiment, it is possible to get the ideal r 2 value by linear regression. So how to fit if the linear is not ideal? As an enterprise with more than 10 years experience in Elisa production, we would recommend polynomial fitting to improve the linear regression linear problem.
The second type of quadratic polynomial fitting regression equation: The quadratic polynomial forms a parabolic shape, with the opening pointing downwards or upwards. In many ELISA experiments, fitting approximates the ascending or descending segments of the quadratic polynomial. Therefore, when using quadratic polynomial fitting, it is best to ensure that the range of values falls within the ascending or descending segments of the curve. The fitting function equation is: y=ax2+bx+c
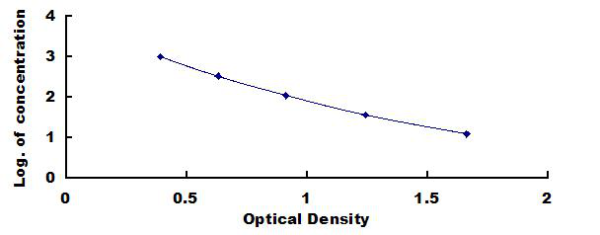
The third type of logarithmic fitting regression equation: We will calculate the O The D measurement is set to the x-axis, the logarithm of the standard concentration is taken as the y-axis, and the concentration is the independent variable, O D. Value is the dependent variable for curve fitting.
The last method is the four parameter fitting regression equation: both the competition method and the sandwich method can be used. Its shape, depending on the situation, may be a monotonically increasing exponential, logarithmic, or hyperbolic curve, a monotonically decreasing curve, or an S-shaped curve. It requires that the X value cannot be less than 0 (because the exponent is a real number, there is this requirement). In many cases, it can fit the reaction curve of ELISA, so it has become one of the most widely used models in ELISA.
Although there are many methods for curve fitting, it is necessary to choose the most suitable curve fitting model based on the characteristics of different types of ELISA itself in order to obtain the most reasonable experimental results. In general, it is necessary to comprehensively consider the trend direction of the standard curve, the size of the R value, and the sample drop situation.
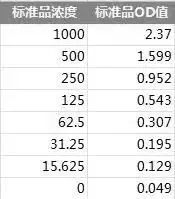
Using Excel to easily create ELISA standard curves in four steps!
Step 1: Enter concentration and OD values in an Excel spreadsheet
Step 2: Paste the numerical part into ELISA Calc
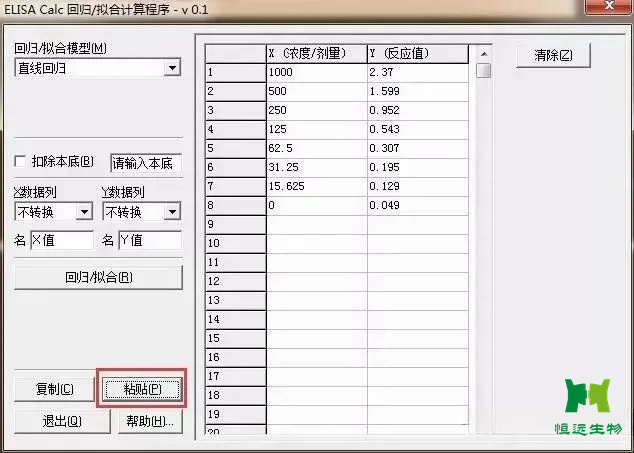
Step 3: Select regression/fitting model
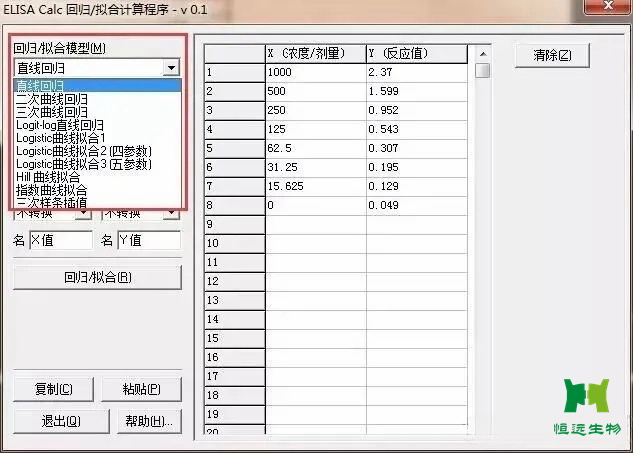
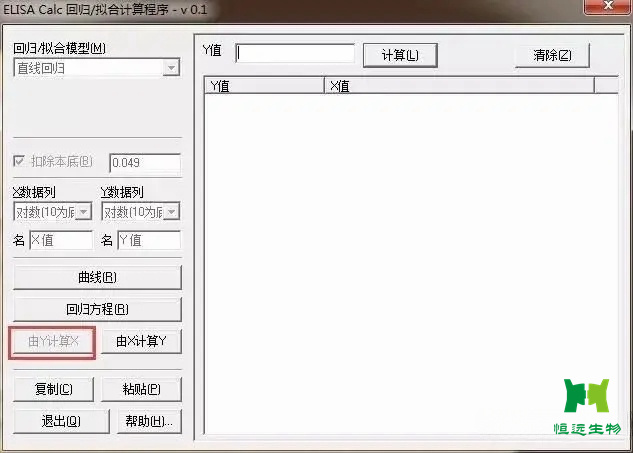
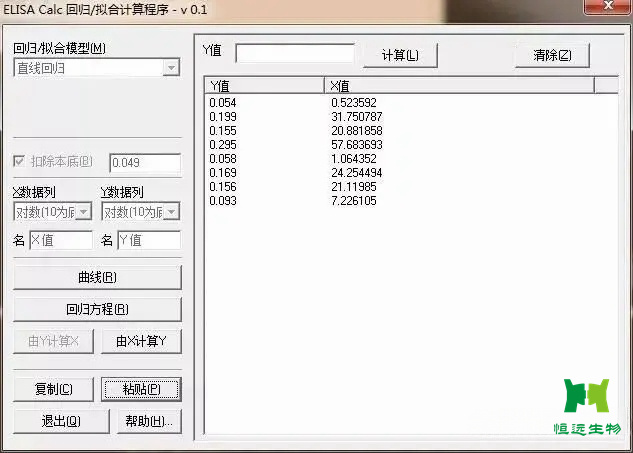
Step 4: Calculate X from Y
Shanghai Hengyuan Biotechnology Co., Ltd. has its own laboratory and a professional technical research and development team. It has been committed to the research and sales of various biological reagents, cells, serum, and ELISA kits for a long time. We provide free testing services for experiments and exquisite technical services. If you have any questions about experiments, please feel free to come and consult us, and we will provide you with professional one-on-one technical guidance.
Related News
- Explanation of references cited in the earthworm 8-hydroxydeoxyguanosine (8-OHdG) ELISA kit
- How to collect high quality animal serum?
- Changyuan Biology | Inflammatory factor-interleukin-6
- Zebrafish Advanced glycation End Products (AGEs)ELISA Manual
- Do you know the method of cell lysis
- Hengyuan biology may day holiday notice
News
The Latest News
- Notice of New Year's Day Holiday for Hengyuan Biology in 2024
- Explanation of references cited in the earthworm 8-hydroxydeoxyguanosine (8-OHdG) ELISA kit
- Warm winter special, right here in Tsunetō!
- Constant biology | those things that fit the ELISA curve
- Hengyuan Biology: This Month Gao Min Elisa kit hot recommendations
- Hengyuan Biology | November new Elisa kit SCI literature, IF total score of 125.8!
- How to collect high quality animal serum?
- Changyuan Biology | Inflammatory factor-interleukin-6
- Hengyuan Biology: Plant Elisa kit new product index recommendation